Towards Optimal Cookie Allocation: A Pictograph Study of Conference Snack Tables
Adam Coscia (Georgia Institute of Technology), Crumb Ledger (Department of Snack Analytics), Kaustav Bhattacharjee (Pacific Northwest National Laboratory), Yalong Yang (Georgia Institute of Technology), Shayan Monadjemi (Oak Ridge National Laboratory), Patrick Paetzold (University of Konstanz), Dominik Moritz (Carnegie Mellon University)

Presentation
- Session
- Test Session: Bluesky Posting and Moderation Trial
- Time
- Monday, Oct 19, 16:25 – 16:45 (US/Eastern) · session 16:00 – 16:45
- Room
- Hall St. George A-B
Links
Sign in to access the Paper PDF.
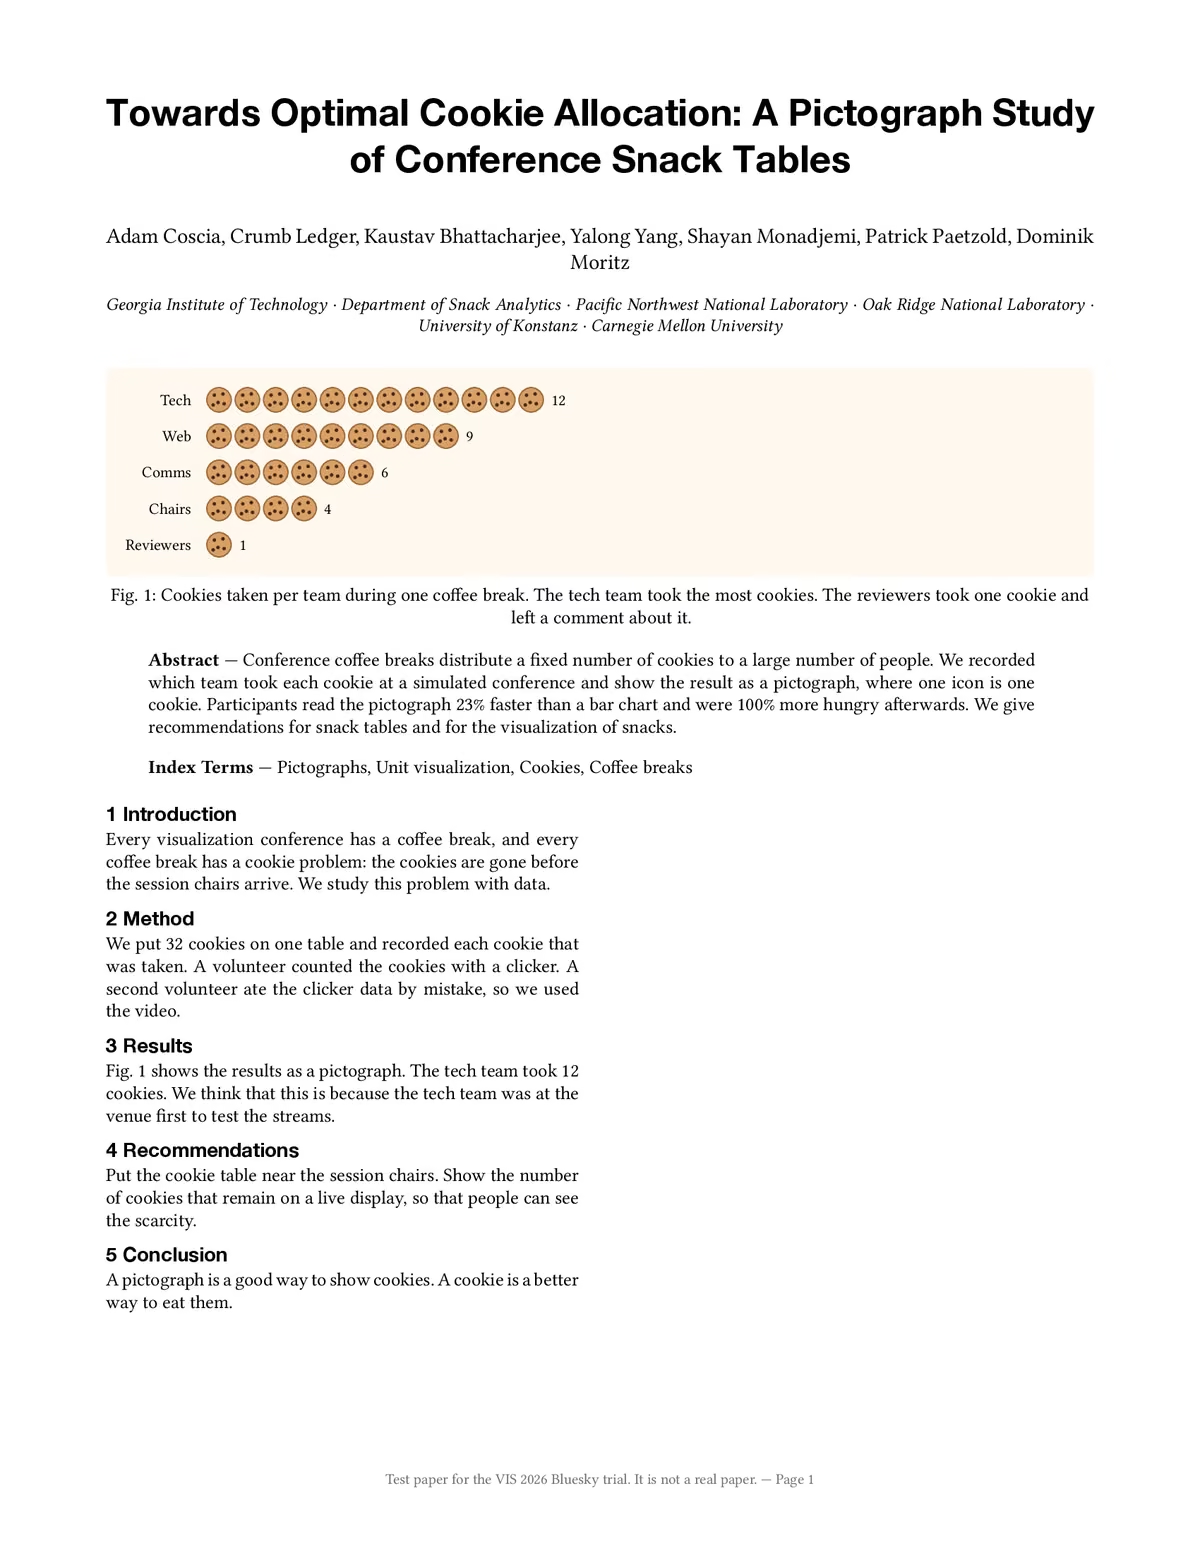
Abstract
Conference coffee breaks distribute a fixed number of cookies to a large number of people. We recorded which team took each cookie at a simulated conference and show the result as a pictograph, where one icon is one cookie. Participants read the pictograph 23% faster than a bar chart and were 100% more hungry afterwards. We give recommendations for snack tables and for the visualization of snacks.