Links
Sign in to access the Paper PDF.
Abstract
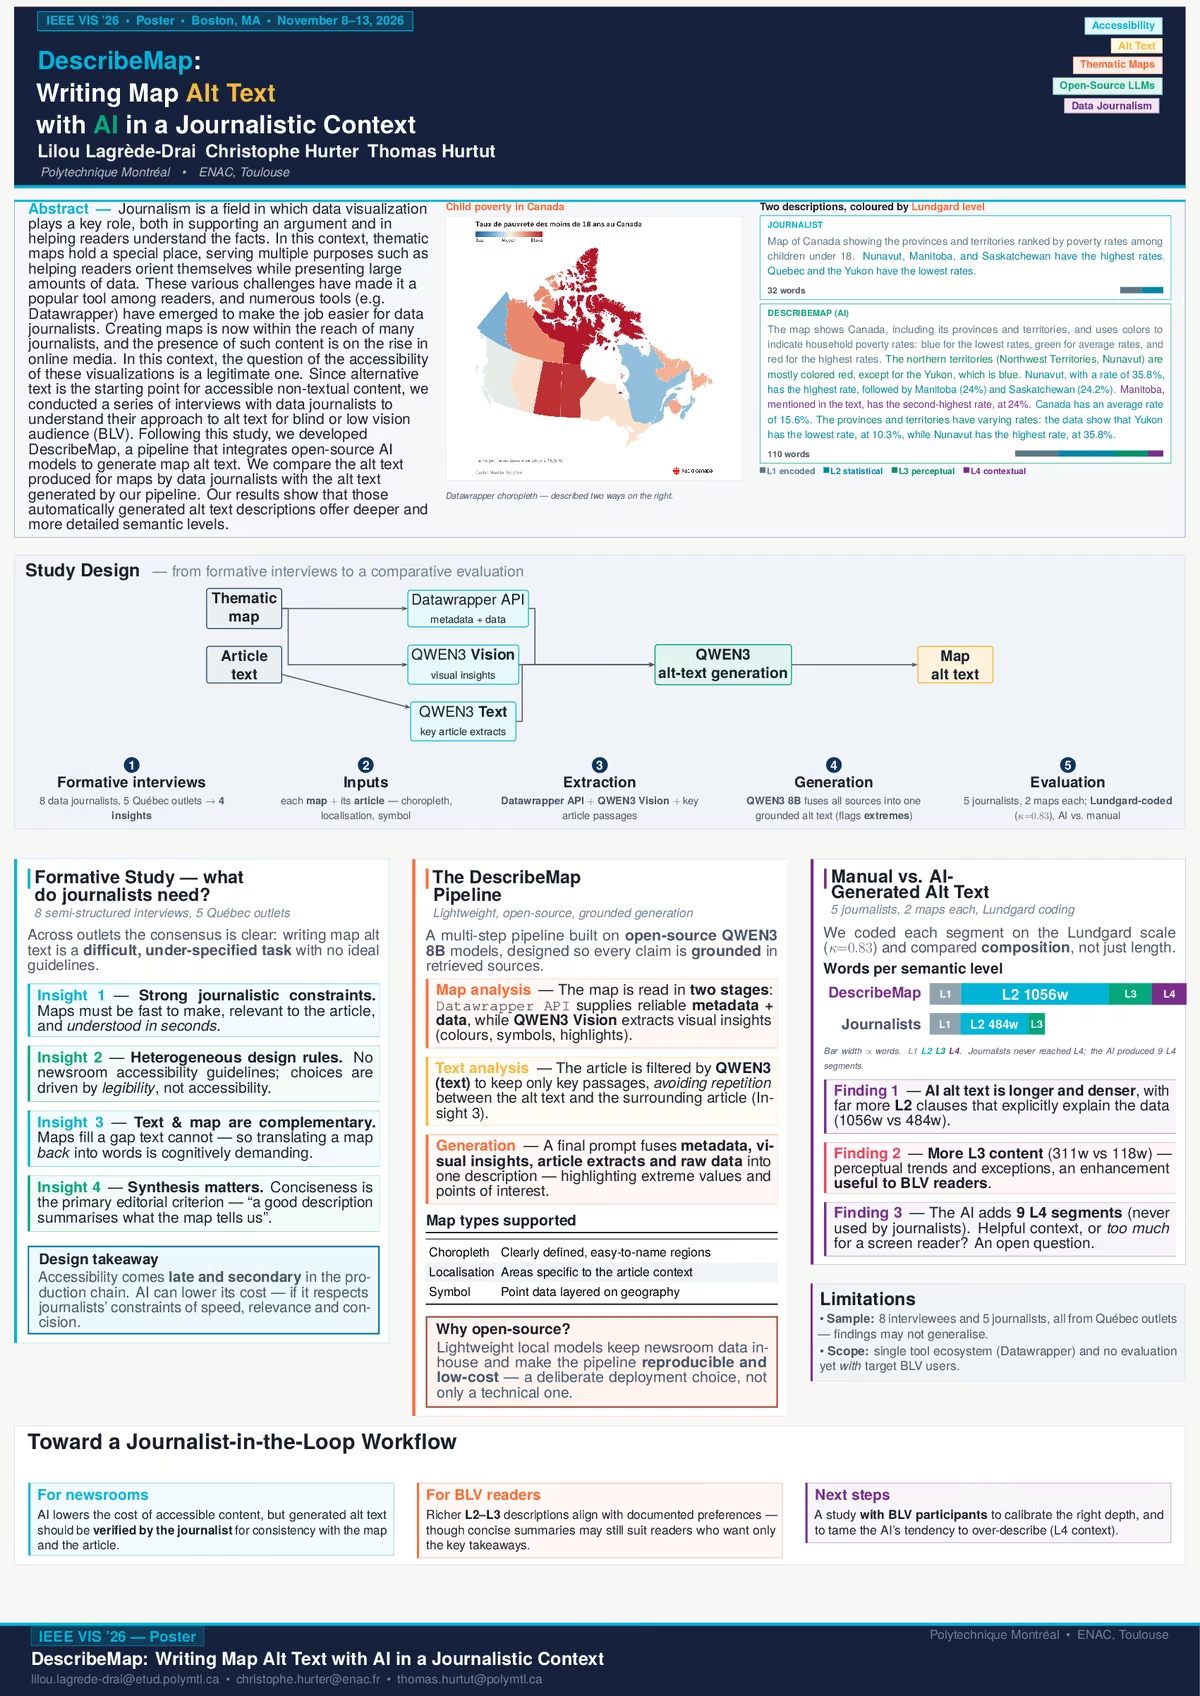
Journalism is a field in which data visualization plays a key role, both in supporting an argument and in helping readers understand the facts. In this context, thematic maps hold a special place, serving multiple purposes such as helping readers orient themselves while presenting large amounts of data. These various challenges have made it a popular tool among readers, and numerous tools (e.g. Datawrapper) have emerged to make the job easier for data journalists. Creating maps is now within the reach of many journalists, and the presence of such content is on the rise in online media. In this context, the question of the accessibility of these visualizations is a legitimate one. Since alternative text is the starting point for accessible non-textual content, we conducted a series of interviews with data journalists to understand their approach to alt text for blind or low vision audience (BLV). Following this study, we developed DescribeMap, a pipeline that integrates open-source AI models to generate map alt text. We compare the alt text produced for maps by data journalists with the alt text generated by our pipeline. Our results show that those automatically generated alt text descriptions offer deeper and more detailed semantic levels.