Links
Sign in to access the Paper PDF.
Abstract
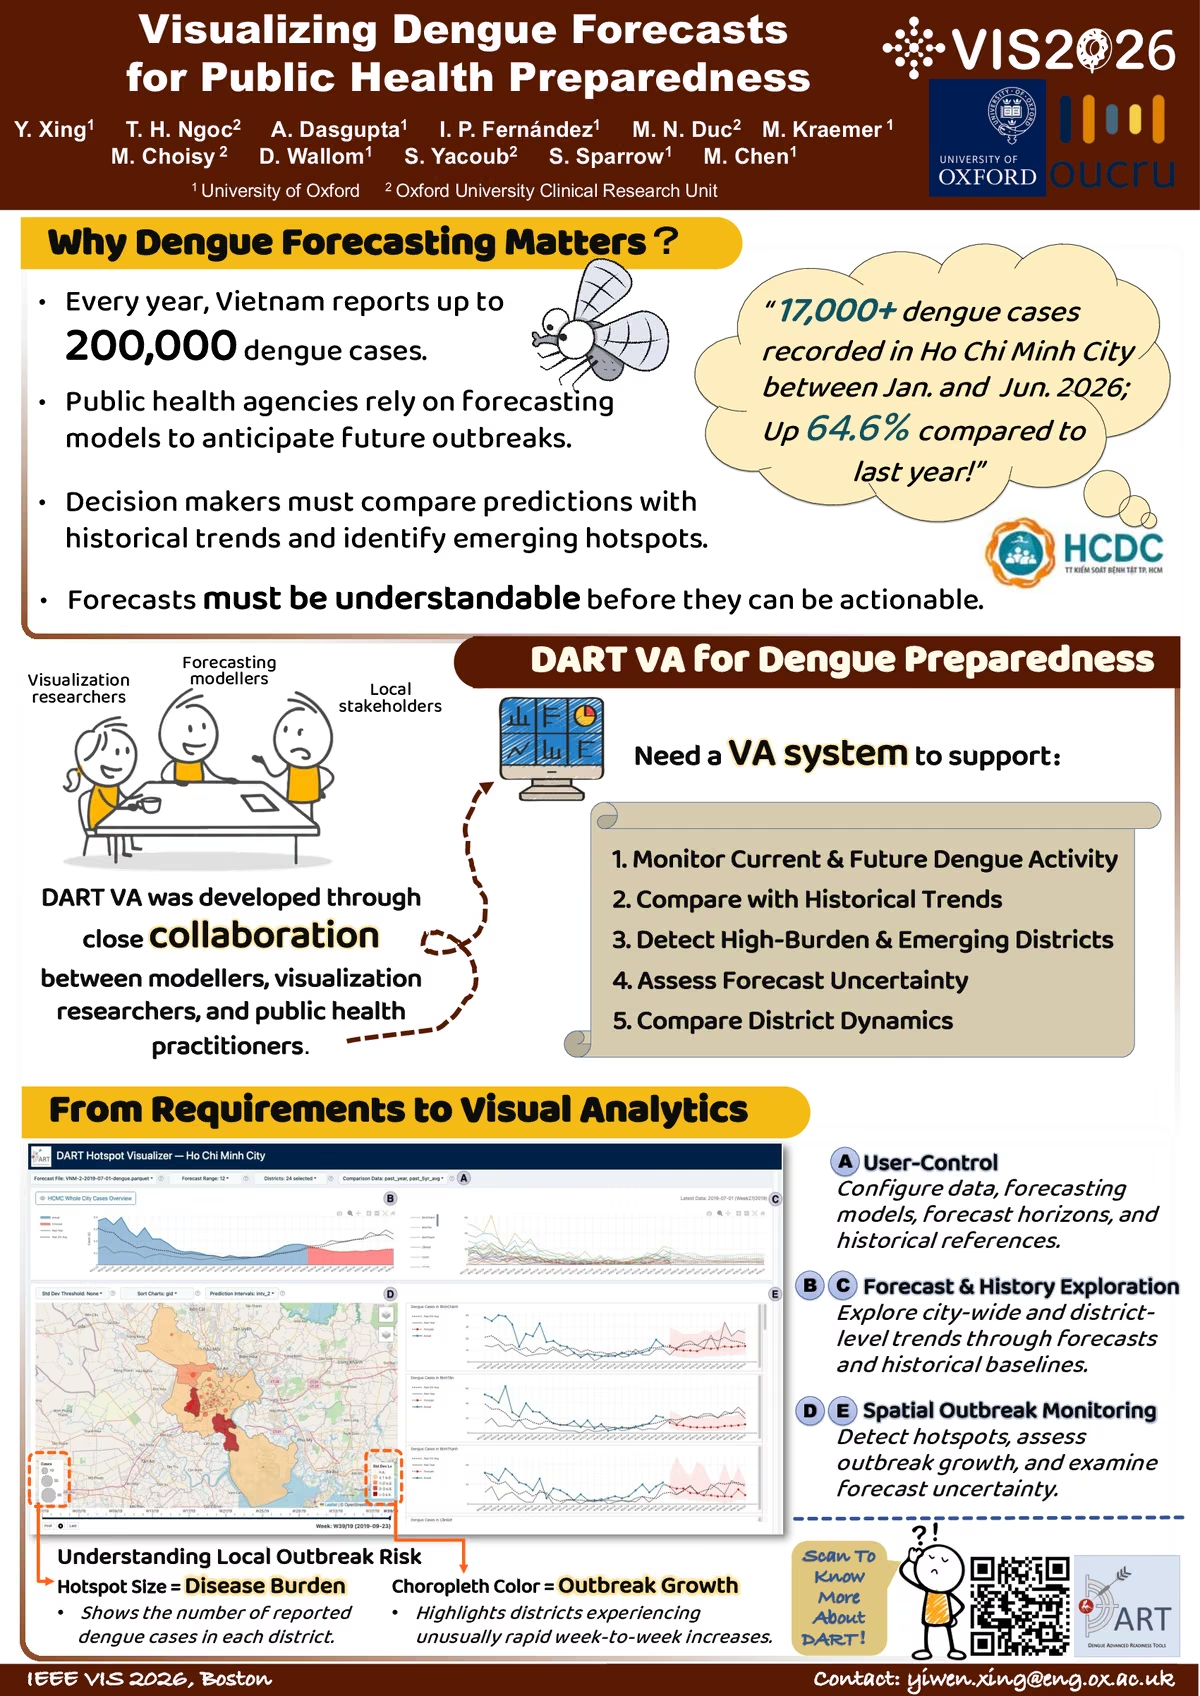
Forecasting infectious disease outbreaks is not only a modelling challenge but also a visualization challenge. Public health practitioners must interpret forecasts, compare them with historical trends, and identify emerging outbreak hotspots to support timely interventions. We present a visual analytics system developed within the Dengue Advanced Readiness Tools (DART) project. Designed with Ho Chi Minh City Center for Disease Control (HCDC) stakeholders, the system integrates dengue surveillance data, machine learning forecasts, and historical reference data into a coordinated spatiotemporal interface. The system supports city-level forecasting, district-level comparison, uncertainty-aware exploration, and linked spatial-temporal analysis of dengue dynamics. The prototype is deployed on the infrastructure of Oxford University Clinical Research Unit (OUCRU) and is undergoing pilot evaluation with HCDC. The system also highlights opportunities for visual analytics to support epidemiological model development.