Anchoring and Alignment: Data Factors in Part-to-Whole Visualization
Connor Bailey -
Michael Gleicher -
Download Supplemental Material
Room: Hall M2
2025-11-05T11:18:00.000ZGMT-0600Change your timezone on the schedule page
2025-11-05T11:18:00.000Z
https://youtu.be/FOAj5-NjQho
Keywords
part-to-whole, estimation, graphical perception, anchoring, alignment, rounding, perceptual mechanisms.
Abstract
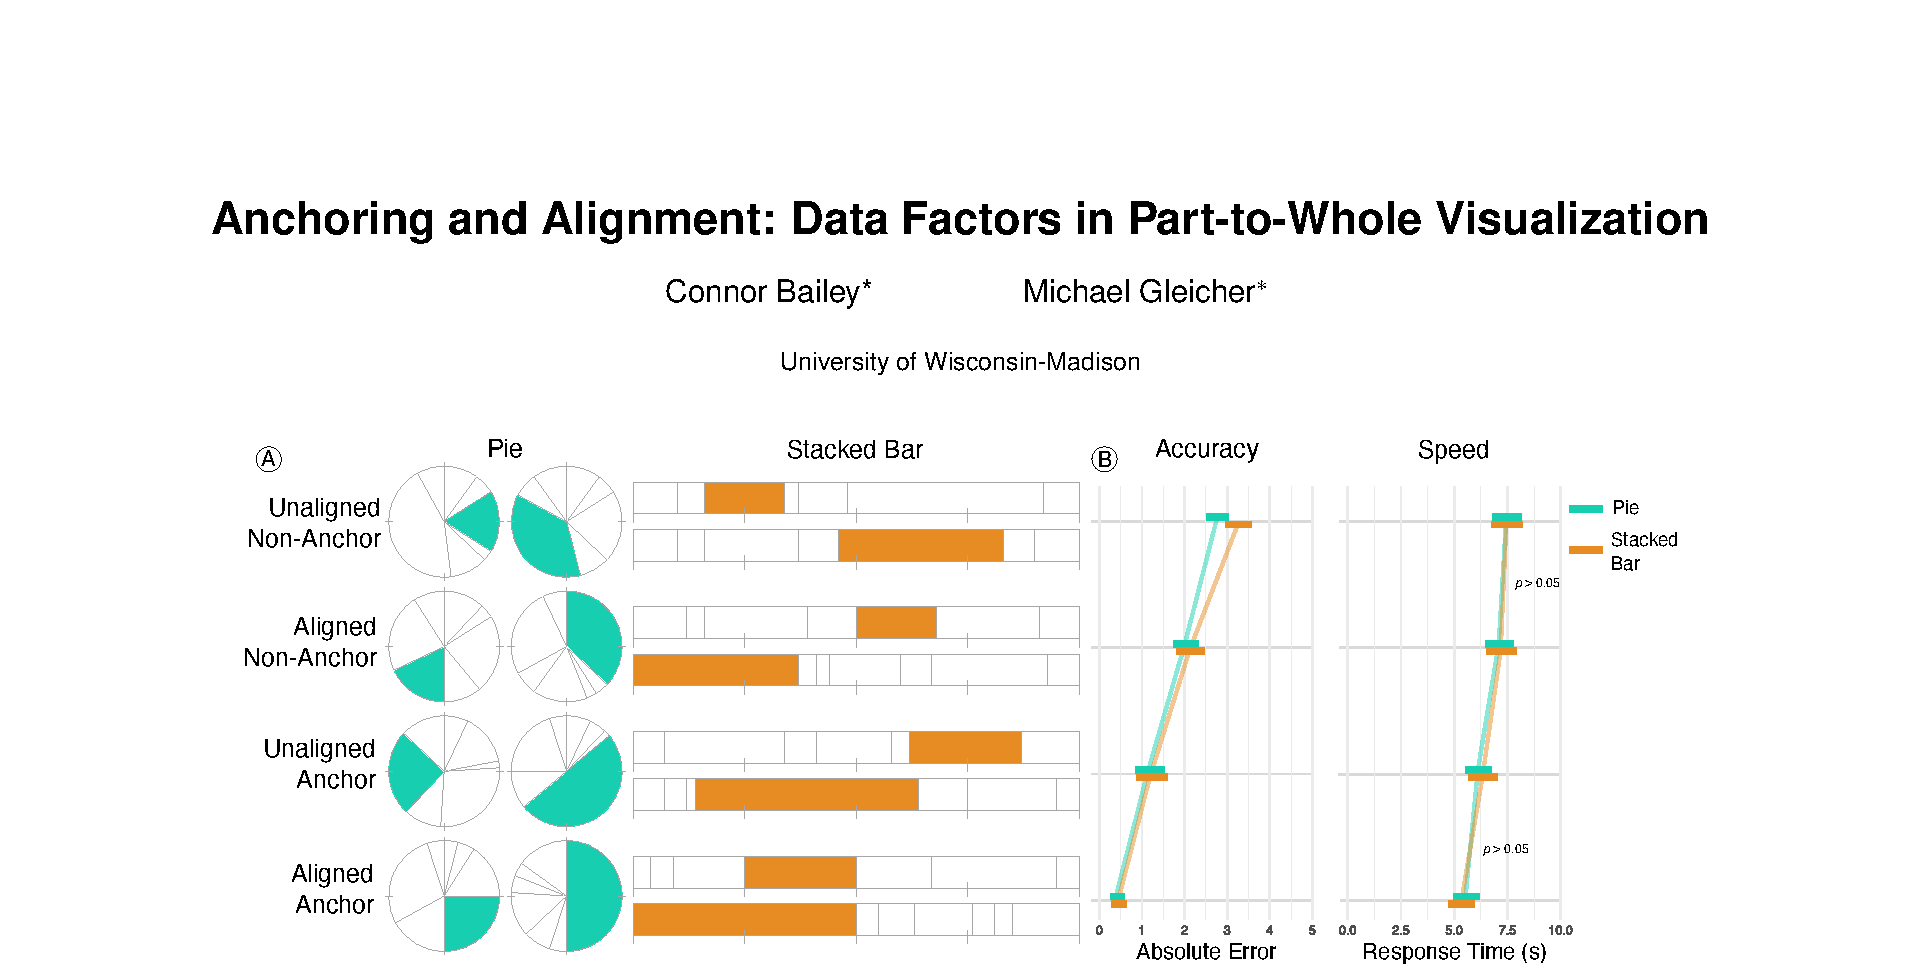
We explore the effects of data and design considerations through the example case of part-to-whole data relationships. Standard part-to-whole representations like pie charts and stacked bar charts make the relationships of parts to the whole explicit. Value estimation in these charts benefits from two perceptual mechanisms: anchoring, where the value is close to a reference value with an easily recognized shape, and alignment where the beginning or end of the shape is aligned with a marker. In an online study, we explore how data and design factors such as value, position, and encoding together impact these effects in making estimations in part-to-whole charts. The results show how salient values and alignment to positions on a scale affect task performance. This demonstrates the need for informed visualization design based around how data properties and design factors affect perceptual mechanisms.