IEEE VIS 2025 Content: Does visualization help AI understand data?

Does visualization help AI understand data?

Johnathan Sun -

Victoria Li -

Martin Wattenberg -

Image not found
Anyone who works with datasets, ranging from scientists to data journalists and students, could be interested in reading this paper. Our results suggest that visualization may have a significant role to play in AI-enabled data analysis workflows. As AI tools become increasingly ubiquitous and sometimes autonomous, anyone interested in getting the most out of them might be curious about the importance of visual input in facilitating model data understanding. Indeed, we hope the visualization community, including scientists, designers, and developers, take interest in visualization for AI as a new and impactful design space. Our research, while preliminary, may lead to practical changes in the ways we present quantitative information to AI models across knowledge domains. Practitioners, especially when conducting exploratory data analysis, could take away trying both scenarios: (1) inputting full datasets into a model (even a couple hundred points) with a simple visualization, and (2) just the visualization itself as a starting point to understand salient dataset characteristics. Both scenarios may result in helpful analysis, but our results suggest the first may include convenient statistical data analysis, and the second a concise summary of standout features. This quick, accessible workflow could help any data analyst collaborate more effectively with AI systems. Practitioners would also learn how easily AIs may be silently tripped up by inconsistent data and visualization inputs. They might begin exercising more caution when conducting exploratory data and visual analysis with an AI, which may not realize or mention potential discrepancies in its inputs. Finally, practitioners may also be excited about how visualization design may evolve in the future. If the VIS community builds on our work to design charts or graphs that more effectively elicit insights from models, AI-enabled workflows could become more powerful and efficient, allowing humans and AI to jointly tackle more complex empirical questions. Overall, our results lay groundwork for both immediate and future implications for practitioners in a world with increasingly powerful AI systems.
Keywords

AI, Workflow Design, Human-Machine Analysis.
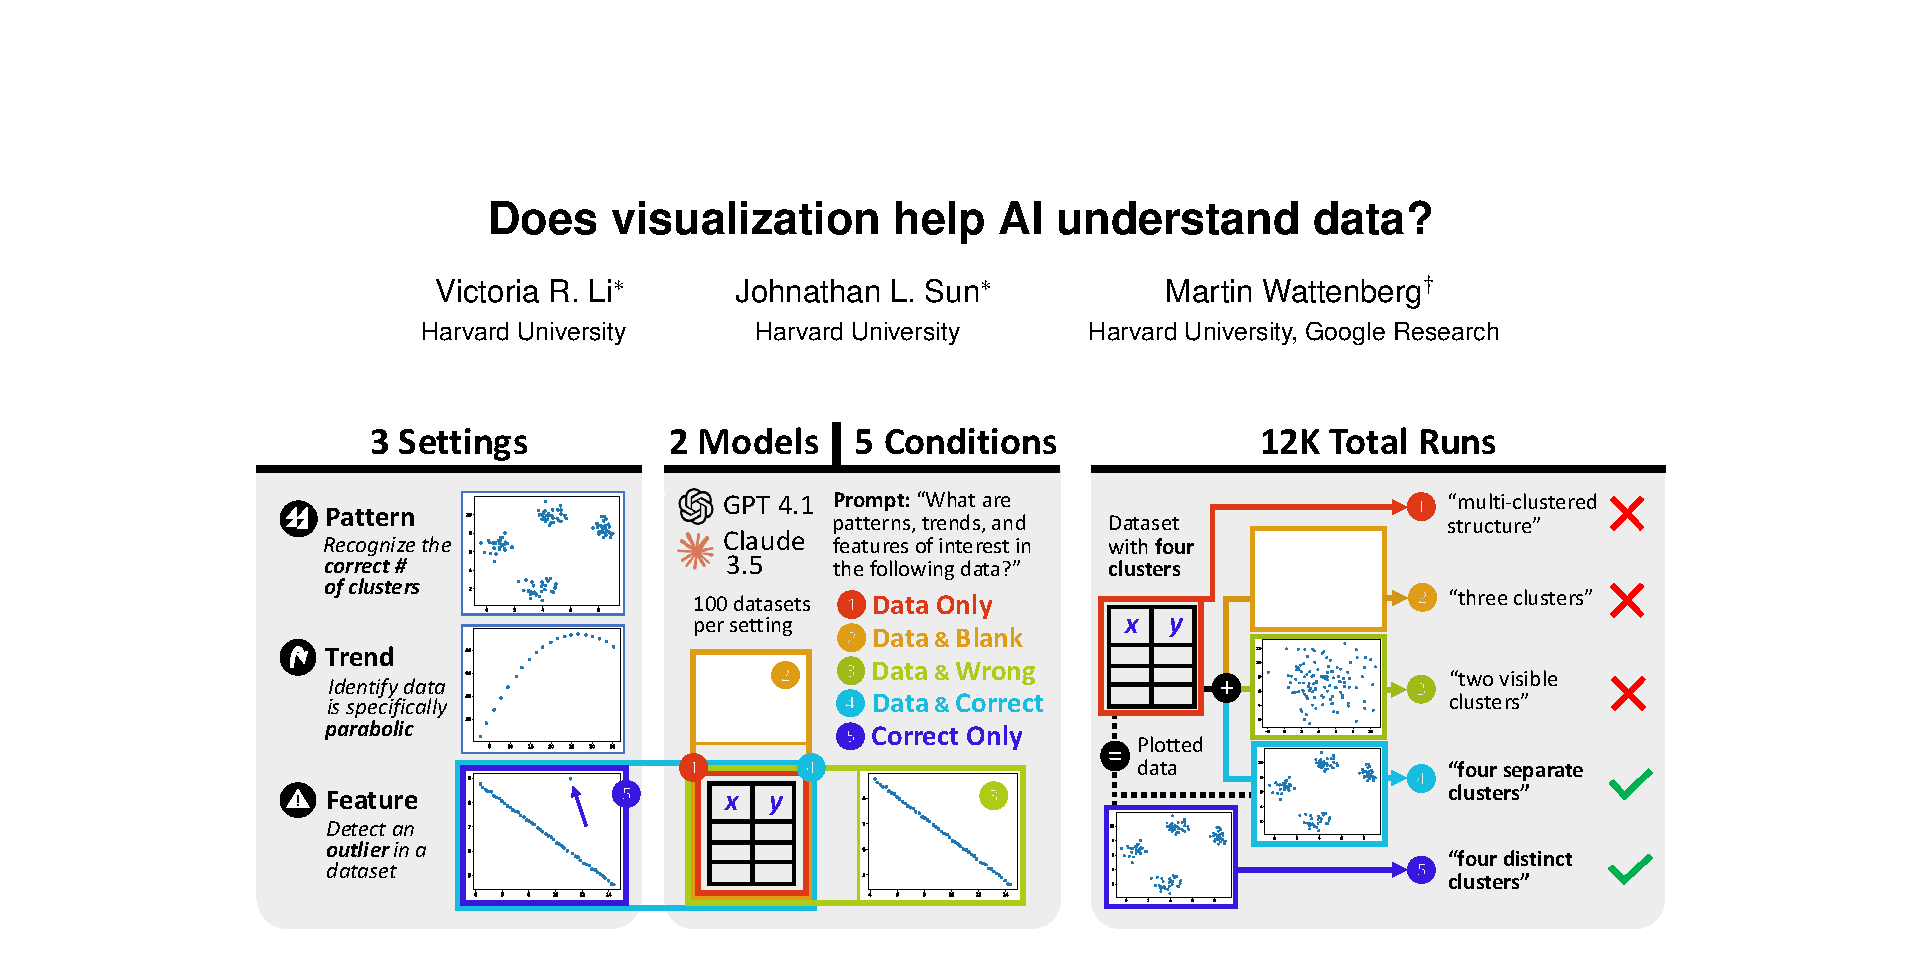
Abstract

Charts and graphs help people analyze data, but can they also be useful to AI systems? To investigate this question, we perform a series of experiments with two commercial vision-language models: GPT 4.1 and Claude 3.5. Across three representative analysis tasks, the two systems describe synthetic datasets more precisely and accurately when raw data is accompanied by a scatterplot, especially as datasets grow in complexity. Comparison with two baselines---providing a blank chart and a chart with mismatched data---shows that the improved performance is due to the content of the charts. Our results are initial evidence that AI systems, like humans, can benefit from visualization.