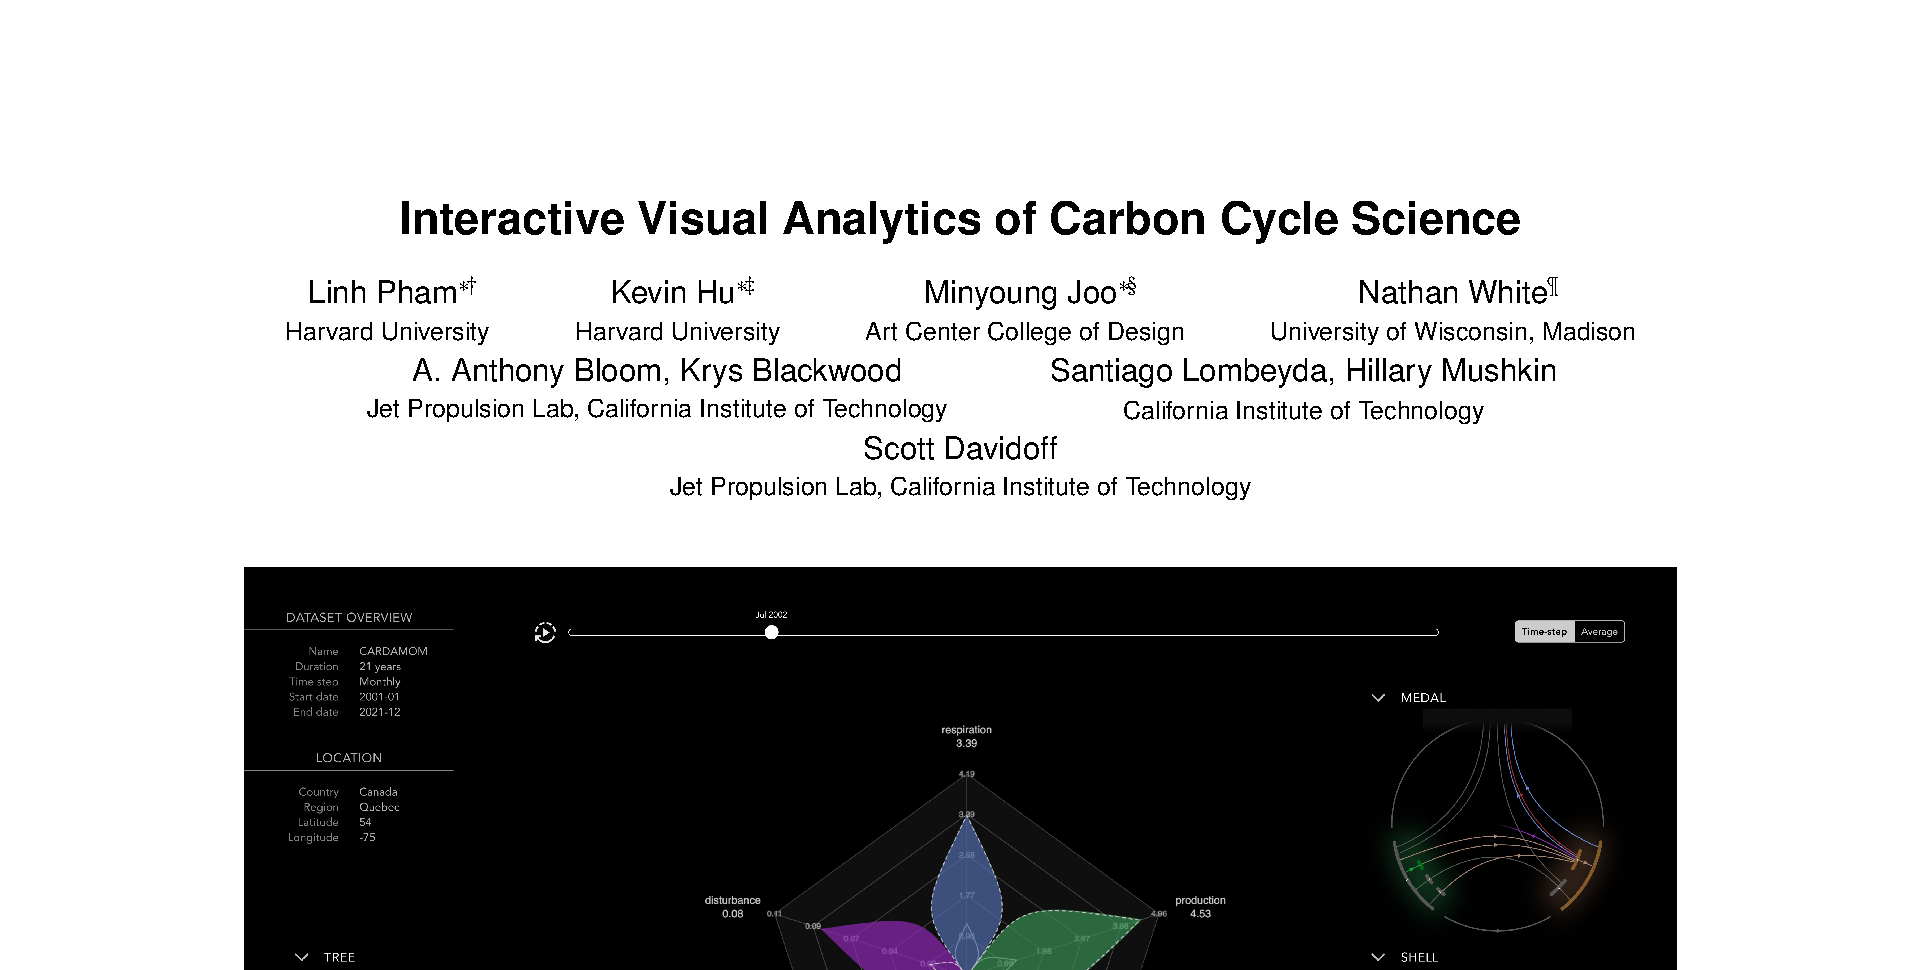
Interactive Visual Analytics of Carbon Cycle Science
Linh Pham -
Kevin Hu -
Minyoung Joo -
Nathan White -
Anthony Bloom -
Krys Blackwood -
Santiago Lombeyda -
Hillary Mushkin -
Scott Davidoff -
Screen-reader Accessible PDF
Room: Hall M1
2025-11-05T11:00:00.000ZGMT-0600Change your timezone on the schedule page
2025-11-05T11:00:00.000Z
https://youtu.be/ne2Eq3Co7xU
Keywords
earth system, bayesian carbon cycle, design study
Abstract
Tracking the flow of carbon (C) through the Earth’s terrestrial biosphere remains a major challenge to understanding how ecosystems respond to environmental change [12]. To build an understanding of this flow, researchers have recently developed models that include thousands of variables whose intricate inter-dependencies can make them difficult to interpret. To open this scientific black box, we partnered with C cycle scientists at the NASA Jet Propulsion Lab who developed the Carbon Data-Model (CARDAMOM) framework [5]. This paper presents a design study of CLOVE, a C science visual analytics application that encodes model dimensions in an intuitive way by using visual metaphors that correspond to the natural world. We describe how CLOVE encapsulates C states and fluxes in complex models, and explains how C cycle scientists can use it to diagnose their model outputs.