AdVizor: Using Visual Explanations to Guide Data-Driven Student Advising
Riley Weagant - Ontario Tech University, Oshawa, Canada
Zixin Zhao - Ontario Tech University, Oshawa, Canada
Adam Badley - Ontario Tech University, Oshawa, Canada
Christopher Collins - Ontario Tech University, Oshawa, Canada
Room: Esplanade Suites I + II + III
2024-10-13T13:10:00ZGMT-0600Change your timezone on the schedule page
2024-10-13T13:10:00Z

Fast forward
Full Video
Abstract
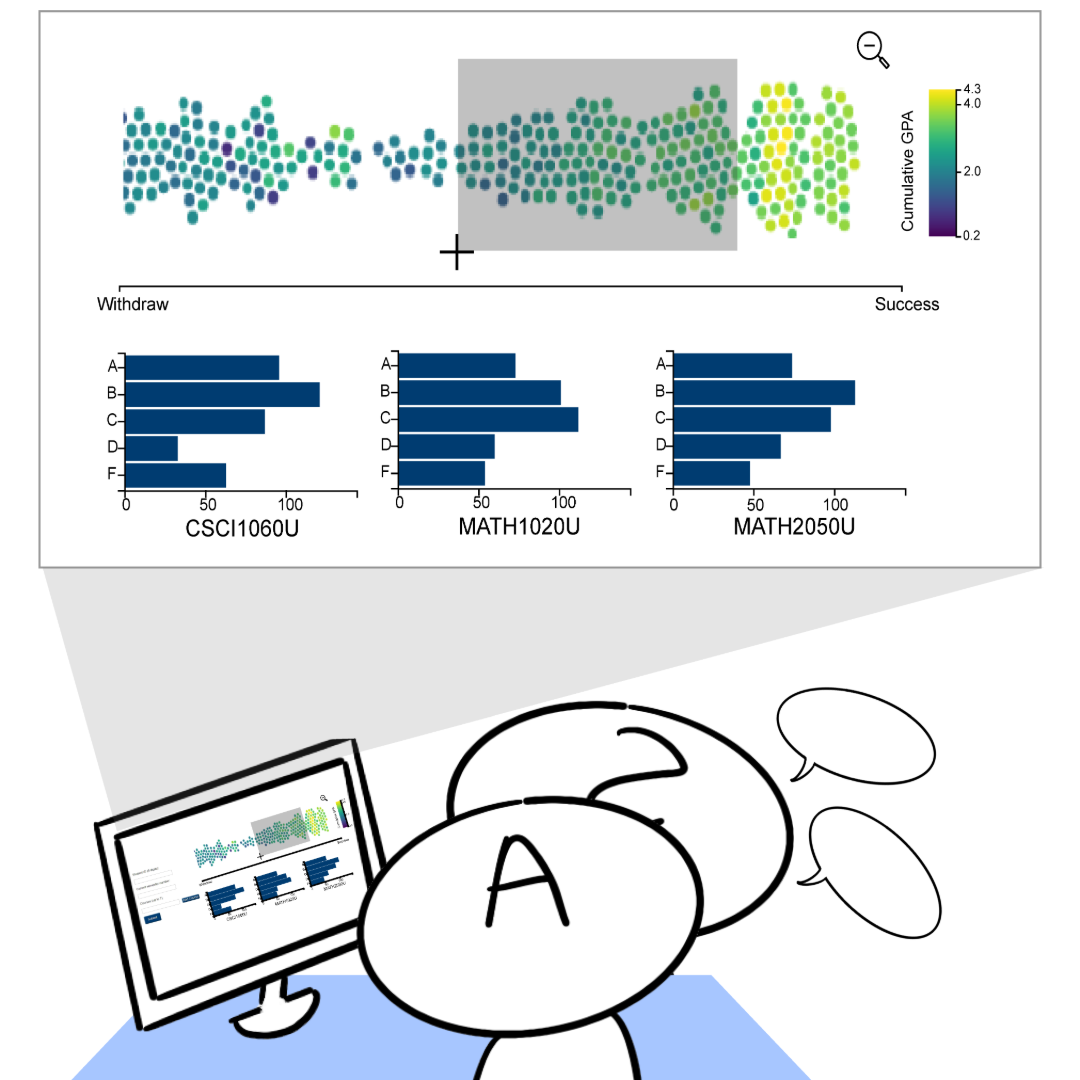
Academic advising can positively impact struggling students' success. We developed AdVizor, a data-driven learning analytics tool for academic risk prediction for advisors. Our system is equipped with a random forest model for grade prediction probabilities uses a visualization dashboard to allows advisors to interpret model predictions. We evaluated our system in mock advising sessions with academic advisors and undergraduate students at our university. Results show that the system can easily integrate into the existing advising workflow, and visualizations of model outputs can be learned through short training sessions. AdVizor supports and complements the existing expertise of the advisor while helping to facilitate advisor-student discussion and analysis. Advisors found the system assisted them in guiding student course selection for the upcoming semester. It allowed them to guide students to prioritize the most critical and impactful courses. Both advisors and students perceived the system positively and were interested in using the system in the future. Our results encourage the development of intelligent advising systems in higher education, catered for advisors.