Uncertainty-Aware Seasonal-Trend Decomposition Based on Loess
Tim Krake -
Daniel Klötzl -
David Hägele -
Daniel Weiskopf -
DOI: 10.1109/TVCG.2024.3364388
Room: Bayshore VI
2024-10-16T14:27:00ZGMT-0600Change your timezone on the schedule page
2024-10-16T14:27:00Z
Fast forward
Full Video
Keywords
- I.6.9.g Visualization techniques and methodologies < I.6.9 Visualization < I.6 Simulation, Modeling, and Visualization < I Compu - G.3 Probability and Statistics < G Mathematics of Computing - G.3.n Statistical computing < G.3 Probability and Statistics < G Mathematics of Computing - G.3.p Stochastic processes < G.3 Probability and Statistics < G Mathematics of Computing
Abstract
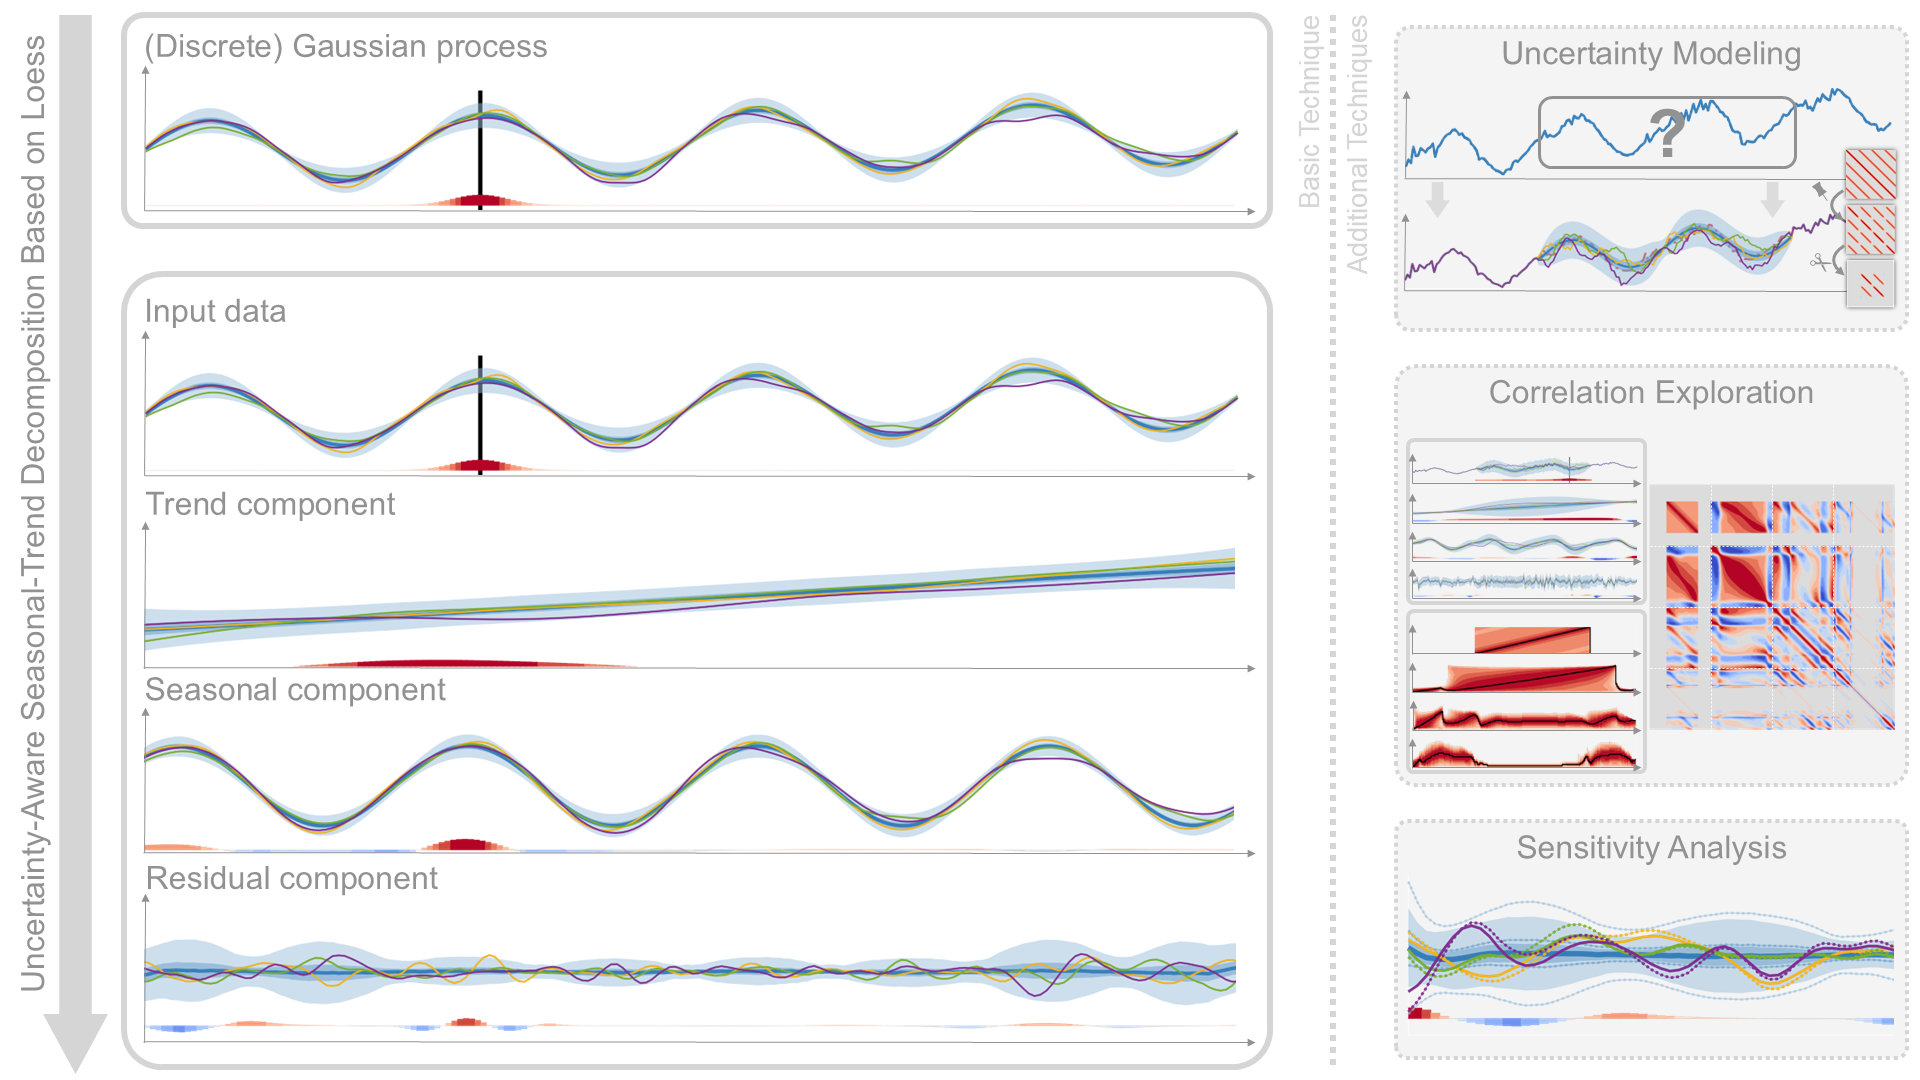
Seasonal-trend decomposition based on loess (STL) is a powerful tool to explore time series data visually. In this paper, we present an extension of STL to uncertain data, named uncertainty-aware STL (UASTL). Our method propagates multivariate Gaussian distributions mathematically exactly through the entire analysis and visualization pipeline. Thereby, stochastic quantities shared between the components of the decomposition are preserved. Moreover, we present application scenarios with uncertainty modeling based on Gaussian processes, e.g., data with uncertain areas or missing values. Besides these mathematical results and modeling aspects, we introduce visualization techniques that address the challenges of uncertainty visualization and the problem of visualizing highly correlated components of a decomposition. The global uncertainty propagation enables the time series visualization with STL-consistent samples, the exploration of correlation between and within decomposition's components, and the analysis of the impact of varying uncertainty. Finally, we show the usefulness of UASTL and the importance of uncertainty visualization with several examples. Thereby, a comparison with conventional STL is performed.