How Does Automation Shape the Process of Narrative Visualization: A Survey of Tools
Qing Chen -
Shixiong Cao -
Jiazhe Wang -
Nan Cao -
Download preprint PDF
DOI: 10.1109/TVCG.2023.3261320
Room: Bayshore I
2024-10-17T16:36:00ZGMT-0600Change your timezone on the schedule page
2024-10-17T16:36:00Z
Fast forward
Full Video
Keywords
Data Visualization, Automatic Visualization, Narrative Visualization, Design Space, Authoring Tools, Survey
Abstract
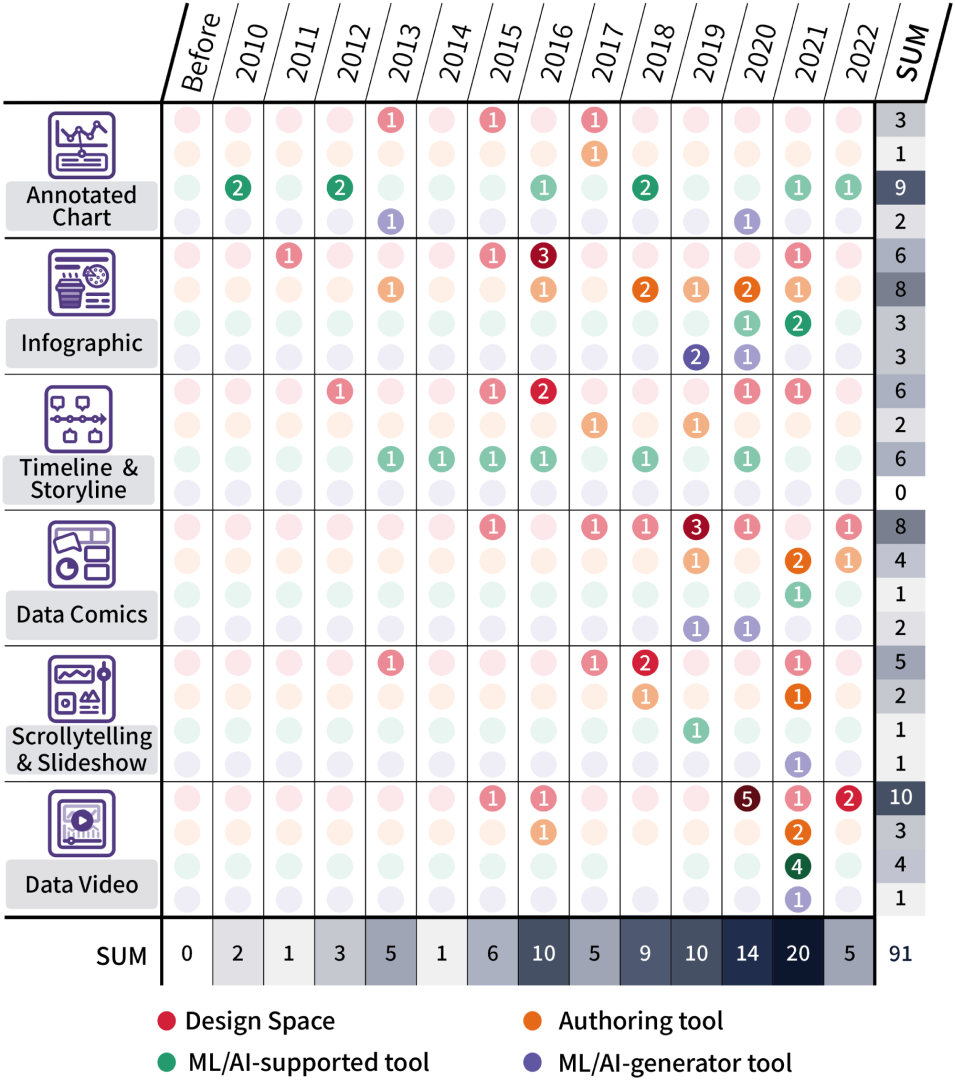
In recent years, narrative visualization has gained much attention. Researchers have proposed different design spaces for various narrative visualization genres and scenarios to facilitate the creation process. As users' needs grow and automation technologies advance, increasingly more tools have been designed and developed. In this study, we summarized six genres of narrative visualization (annotated charts, infographics, timelines & storylines, data comics, scrollytelling & slideshow, and data videos) based on previous research and four types of tools (design spaces, authoring tools, ML/AI-supported tools and ML/AI-generator tools) based on the intelligence and automation level of the tools. We surveyed 105 papers and tools to study how automation can progressively engage in visualization design and narrative processes to help users easily create narrative visualizations. This research aims to provide an overview of current research and development in the automation involvement of narrative visualization tools. We discuss key research problems in each category and suggest new opportunities to encourage further research in the related domain.