Groot: A System for Editing and Configuring Automated Data Insights
Sneha Gathani - University of Maryland, College Park, College Park, United States. Tableau Research, Seattle, United States
Anamaria Crisan - Tableau Research, Seattle, United States
Vidya Setlur - Tableau Research, Palo Alto, United States
Arjun Srinivasan - Tableau Research, Seattle, United States
Screen-reader Accessible PDF
Download Supplemental Material
Room: Bayshore VI
2024-10-16T18:30:00ZGMT-0600Change your timezone on the schedule page
2024-10-16T18:30:00Z

Fast forward
Full Video
Keywords
Automated data insights, insight reconfiguration, natural language templates
Abstract
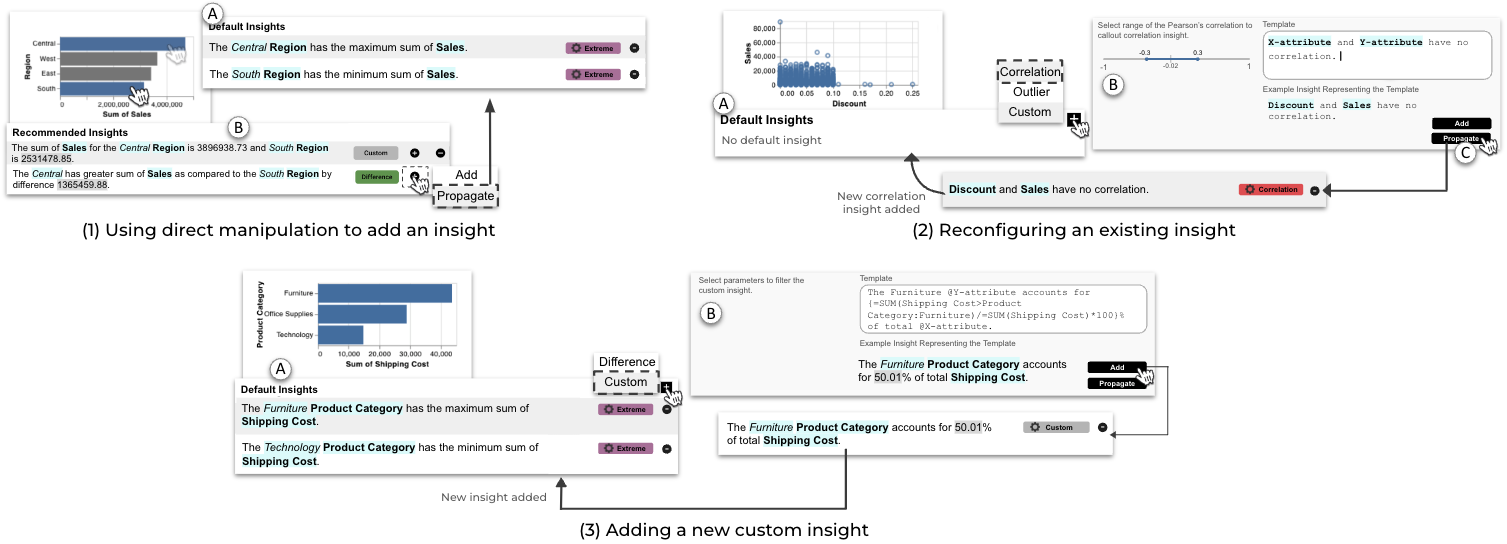
Visualization tools now commonly present automated insights highlighting salient data patterns, including correlations, distributions, outliers, and differences, among others. While these insights are valuable for data exploration and chart interpretation, users currently only have a binary choice of accepting or rejecting them, lacking the flexibility to refine the system logic or customize the insight generation process. To address this limitation, we present Groot, a prototype system that allows users to proactively specify and refine automated data insights. The system allows users to directly manipulate chart elements to receive insight recommendations based on their selections. Additionally, Groot provides users with a manual editing interface to customize, reconfigure, or add new insights to individual charts and propagate them to future explorations. We describe a usage scenario to illustrate how these features collectively support insight editing and configuration and discuss opportunities for future work, including incorporating Large Language Models (LLMs), improving semantic data and visualization search, and supporting insight management.