Best Paper Award
Hypertrix: An indicatrix for high-dimensional visualizations
Shivam Raval - Harvard University, Boston, United States
Fernanda Viegas - Harvard University, Cambridge, United States. Google Research, Cambridge, United States
Martin Wattenberg - Harvard University, Cambridge, United States. Google Research, Cambridge, United States
Screen-reader Accessible PDF
Room: Bayshore I + II + III
2024-10-15T15:10:00ZGMT-0600Change your timezone on the schedule page
2024-10-15T15:10:00Z

Fast forward
Full Video
Keywords
Dimensionality Reduction, High-dimensional data—Distortion—Text Visualization, Clustering
Abstract
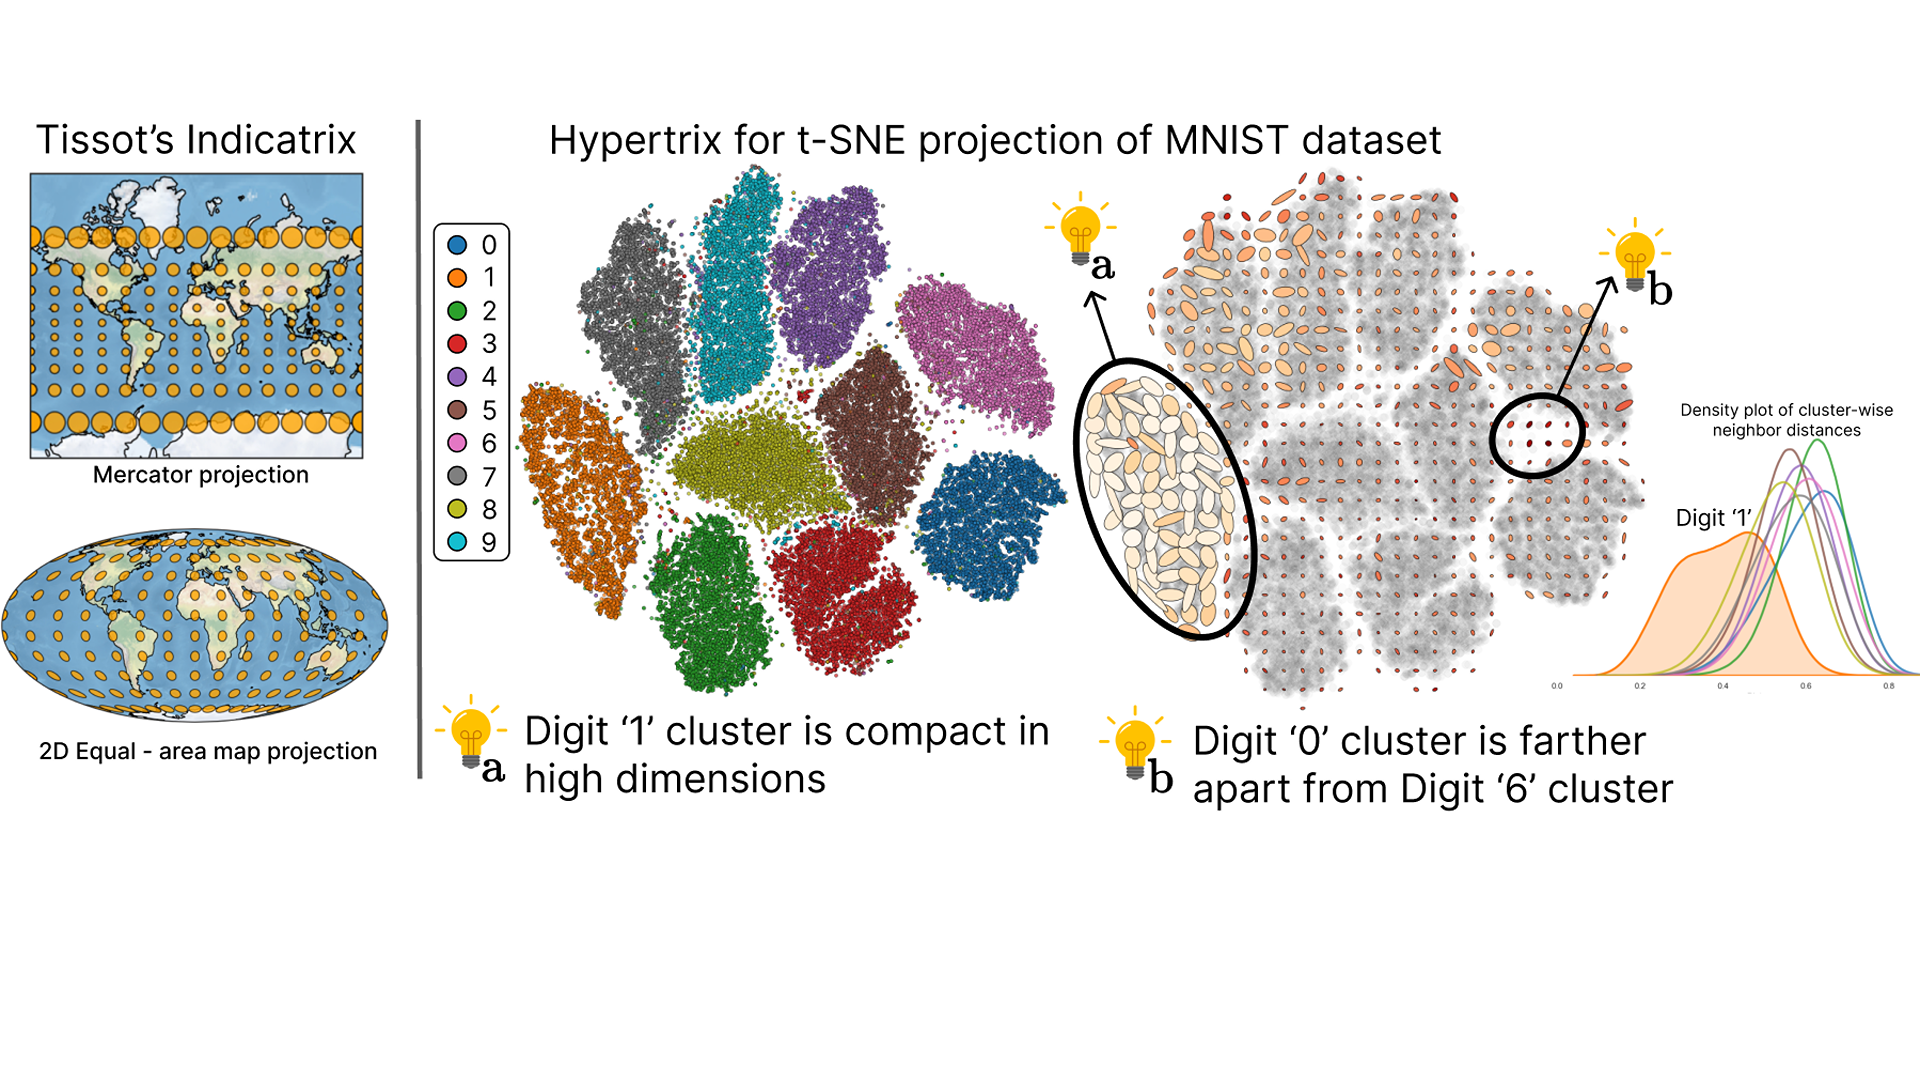
Visualizing high dimensional data is challenging, since any dimensionality reduction technique will distort distances. A classic method in cartography–Tissot’s Indicatrix, specific to sphere-to-plane maps– visualizes distortion using ellipses. Inspired by this idea, we describe the hypertrix: a method for representing distortions that occur when data is projected from arbitrarily high dimensions onto a 2D plane. We demonstrate our technique through synthetic and real-world datasets, and describe how this indicatrix can guide interpretations of nonlinear dimensionality reduction.