Design Patterns in Right-to-Left Visualizations: The Case of Arabic Content
Muna Alebri - University College London, London, United Kingdom. UAE University , Al Ain, United Arab Emirates
Noëlle Rakotondravony - Worcester Polytechnic Institute, Worcester, United States
Lane Harrison - Worcester Polytechnic Institute, Worcester, United States
Screen-reader Accessible PDF
Download preprint PDF
Download Supplemental Material
Room: Bayshore VI
2024-10-17T14:15:00ZGMT-0600Change your timezone on the schedule page
2024-10-17T14:15:00Z

Fast forward
Full Video
Keywords
Design Patterns, Right-To-Left Visualizations, Data Journalism
Abstract
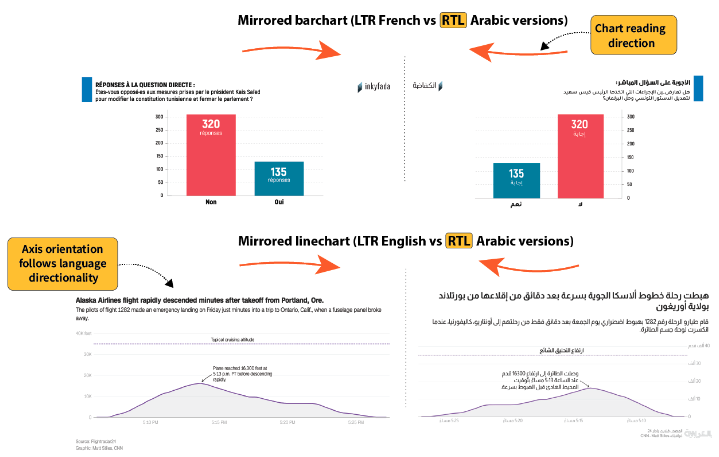
Data visualizations are reaching global audiences. As people who use Right-to-left (RTL) scripts constitute over a billion potential data visualization users, a need emerges to investigate how visualizations are communicated to them. Web design guidelines exist to assist designers in adapting different reading directions, yet we lack a similar standard for visualization design. This paper investigates the design patterns of visualizations with RTL scripts. We collected 128 visualizations from data-driven articles published in Arabic news outlets and analyzed their chart composition, textual elements, and sources. Our analysis suggests that designers tend to apply RTL approaches more frequently for categorical data. In other situations, we observed a mix of Left-to-right (LTR) and RTL approaches for chart directions and structures, sometimes inconsistently utilized within the same article. We reflect on this lack of clear guidelines for RTL data visualizations and derive implications for visualization authoring tools and future research directions.