DASH: A Bimodal Data Exploration Tool for Interactive Text and Visualizations
Dennis Bromley - Tableau Research, Seattle, United States
Vidya Setlur - Tableau Research, Palo Alto, United States
Screen-reader Accessible PDF
Download preprint PDF
Room: Bayshore VI
2024-10-17T14:24:00ZGMT-0600Change your timezone on the schedule page
2024-10-17T14:24:00Z

Fast forward
Full Video
Keywords
Semantic levels, LLMs, text generation
Abstract
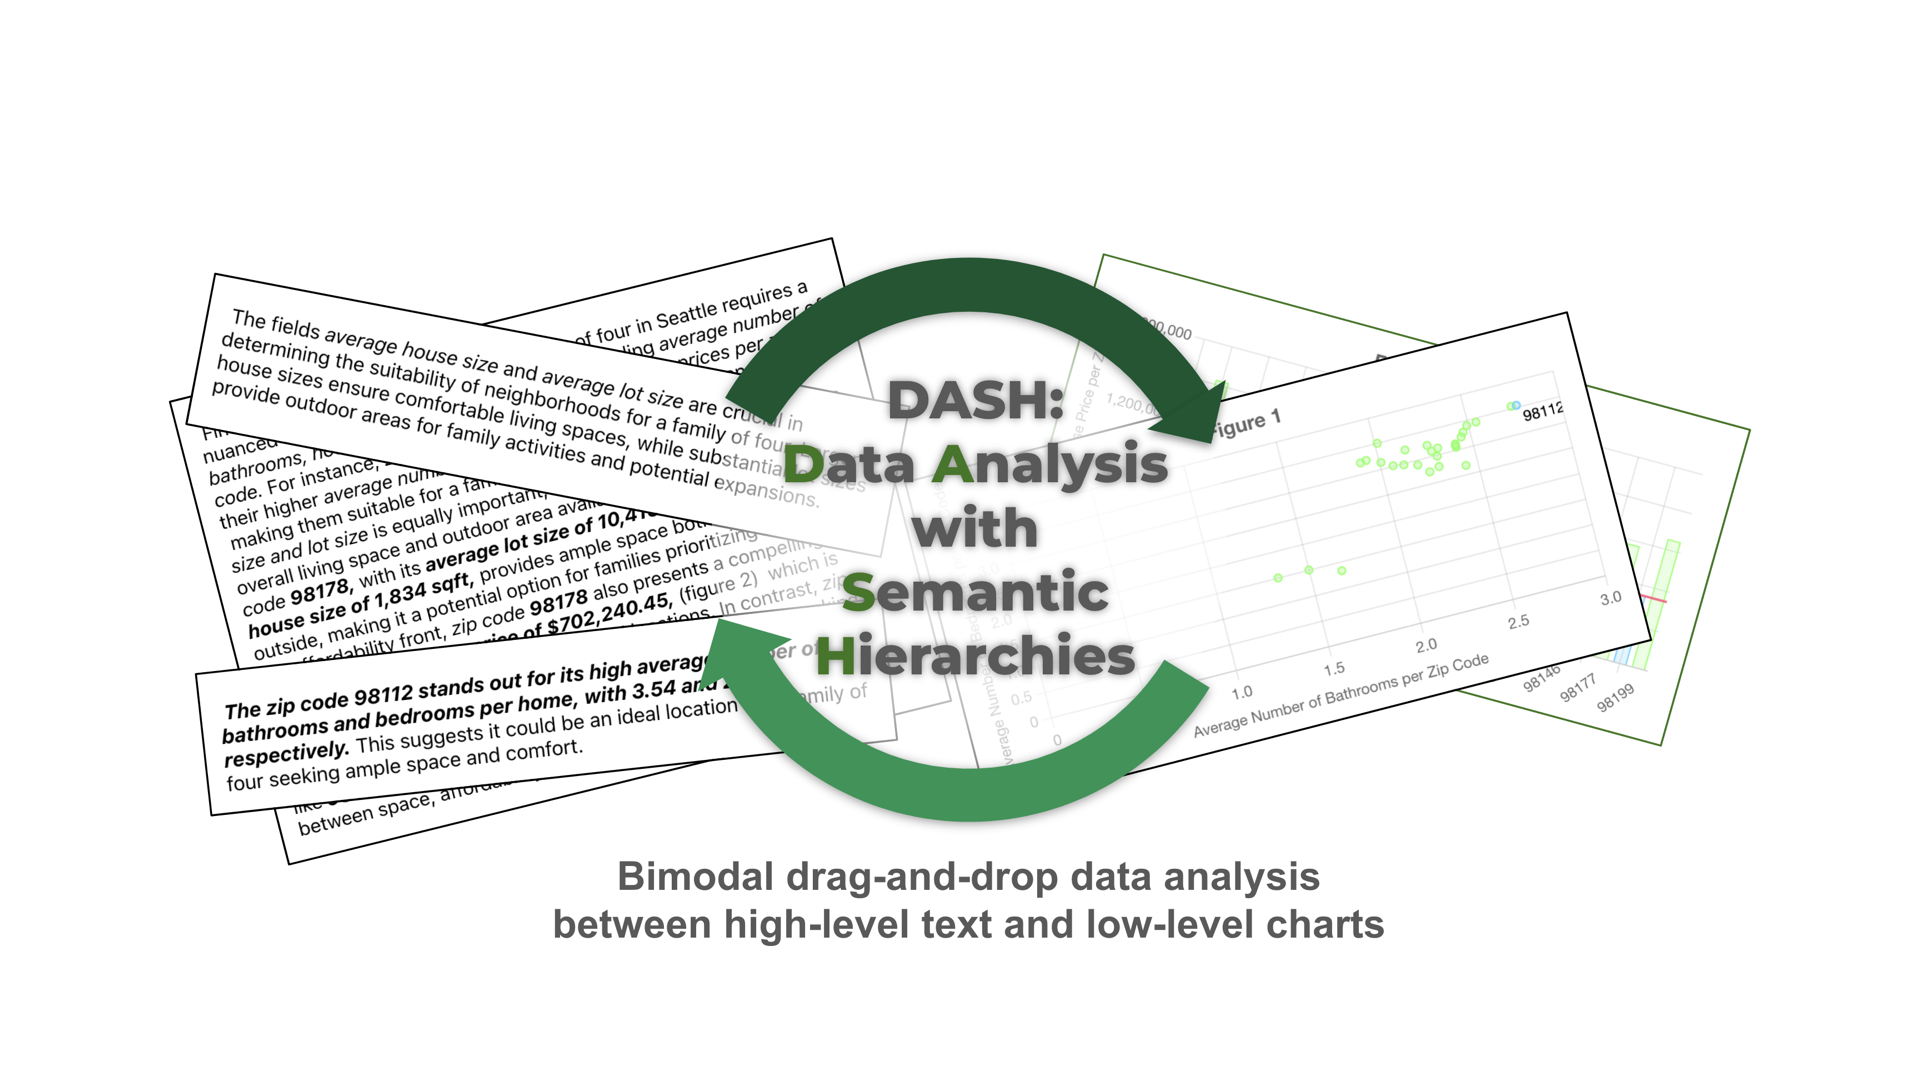
Integrating textual content, such as titles, annotations, and captions, with visualizations facilitates comprehension and takeaways during data exploration. Yet current tools often lack mechanisms for integrating meaningful long-form prose with visual data. This paper introduces DASH, a bimodal data exploration tool that supports integrating semantic levels into the interactive process of visualization and text-based analysis. DASH operationalizes a modified version of Lundgard et al.’s semantic hierarchy model that categorizes data descriptions into four levels ranging from basic encodings to high-level insights. By leveraging this structured semantic level framework and a large language model’s text generation capabilities, DASH enables the creation of data-driven narratives via drag-and-drop user interaction. Through a preliminary user evaluation, we discuss the utility of DASH’s text and chart integration capabilities when participants perform data exploration with the tool.