Cell2Cell: Explorative Cell Interaction Analysis in Multi-Volumetric Tissue Data
Eric Mörth - Harvard Medical School, Boston, United States
Kevin Sidak - University of Vienna, Vienna, Austria
Zoltan Maliga - Harvard Medical School, Boston, United States
Torsten Möller - University of Vienna, Vienna, Austria
Nils Gehlenborg - Harvard Medical School, Boston, United States
Peter Sorger - Harvard University, Cambridge, United States
Hanspeter Pfister - Harvard University, Cambridge, United States
Johanna Beyer - Harvard University, Cambridge, United States
Robert Krüger - New York University, New York, United States. Harvard University, Boston, United States
Download preprint PDF
Room: Bayshore I
2024-10-16T15:03:00ZGMT-0600Change your timezone on the schedule page
2024-10-16T15:03:00Z
Fast forward
Full Video
Keywords
Biomedical visualization, 3D multi-channel tissue data, Direct volume rendering, Quantitative analysis
Abstract
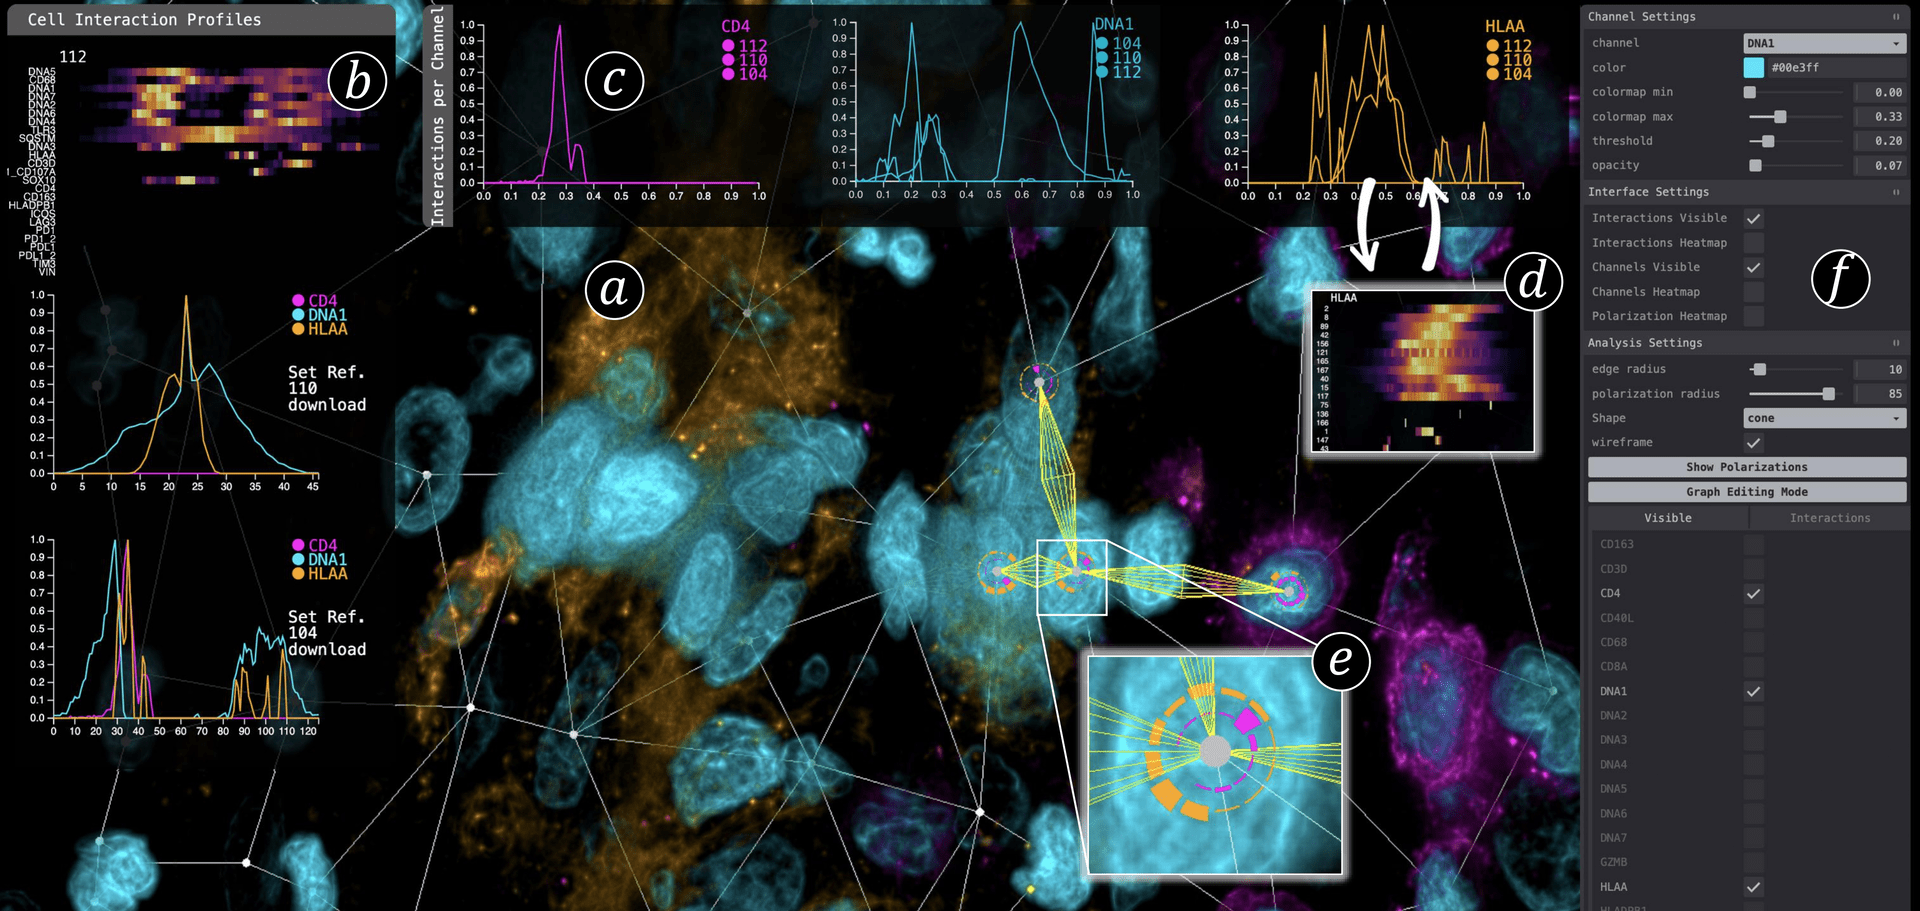
We present Cell2Cell, a novel visual analytics approach for quantifying and visualizing networks of cell-cell interactions in three-dimensional (3D) multi-channel cancerous tissue data. By analyzing cellular interactions, biomedical experts can gain a more accurate understanding of the intricate relationships between cancer and immune cells. Recent methods have focused on inferring interaction based on the proximity of cells in low-resolution 2D multi-channel imaging data. By contrast, we analyze cell interactions by quantifying the presence and levels of specific proteins within a tissue sample (protein expressions) extracted from high-resolution 3D multi-channel volume data. Such analyses have a strong exploratory nature and require a tight integration of domain experts in the analysis loop to leverage their deep knowledge. We propose two complementary semi-automated approaches to cope with the increasing size and complexity of the data interactively: On the one hand, we interpret cell-to-cell interactions as edges in a cell graph and analyze the image signal (protein expressions) along those edges, using spatial as well as abstract visualizations. Complementary, we propose a cell-centered approach, enabling scientists to visually analyze polarized distributions of proteins in three dimensions, which also captures neighboring cells with biochemical and cell biological consequences. We evaluate our application in three case studies, where biologists and medical experts use \tool to investigate tumor micro-environments to identify and quantify T-cell activation in human tissue data. We confirmed that our tool can fully solve the use cases and enables a streamlined and detailed analysis of cell-cell interactions.