Honorable Mention
When Refreshable Tactile Displays Meet Conversational Agents: Investigating Accessible Data Presentation and Analysis with Touch and Speech
Samuel Reinders - Monash University, Melbourne, Australia
Matthew Butler - Monash University, Melbourne, Australia
Ingrid Zukerman - Monash University, Clayton, Australia
Bongshin Lee - Yonsei University, Seoul, Korea, Republic of. Microsoft Research, Redmond, United States
Lizhen Qu - Monash University, Melbourne, Australia
Kim Marriott - Monash University, Melbourne, Australia
Screen-reader Accessible PDF
Download preprint PDF
Room: Bayshore I
2024-10-17T18:09:00ZGMT-0600Change your timezone on the schedule page
2024-10-17T18:09:00Z
Fast forward
Full Video
Keywords
Accessible data visualization, refreshable tactile displays, conversational agents, interactive data exploration, Wizard of Oz study, people who are blind or have low vision
Abstract
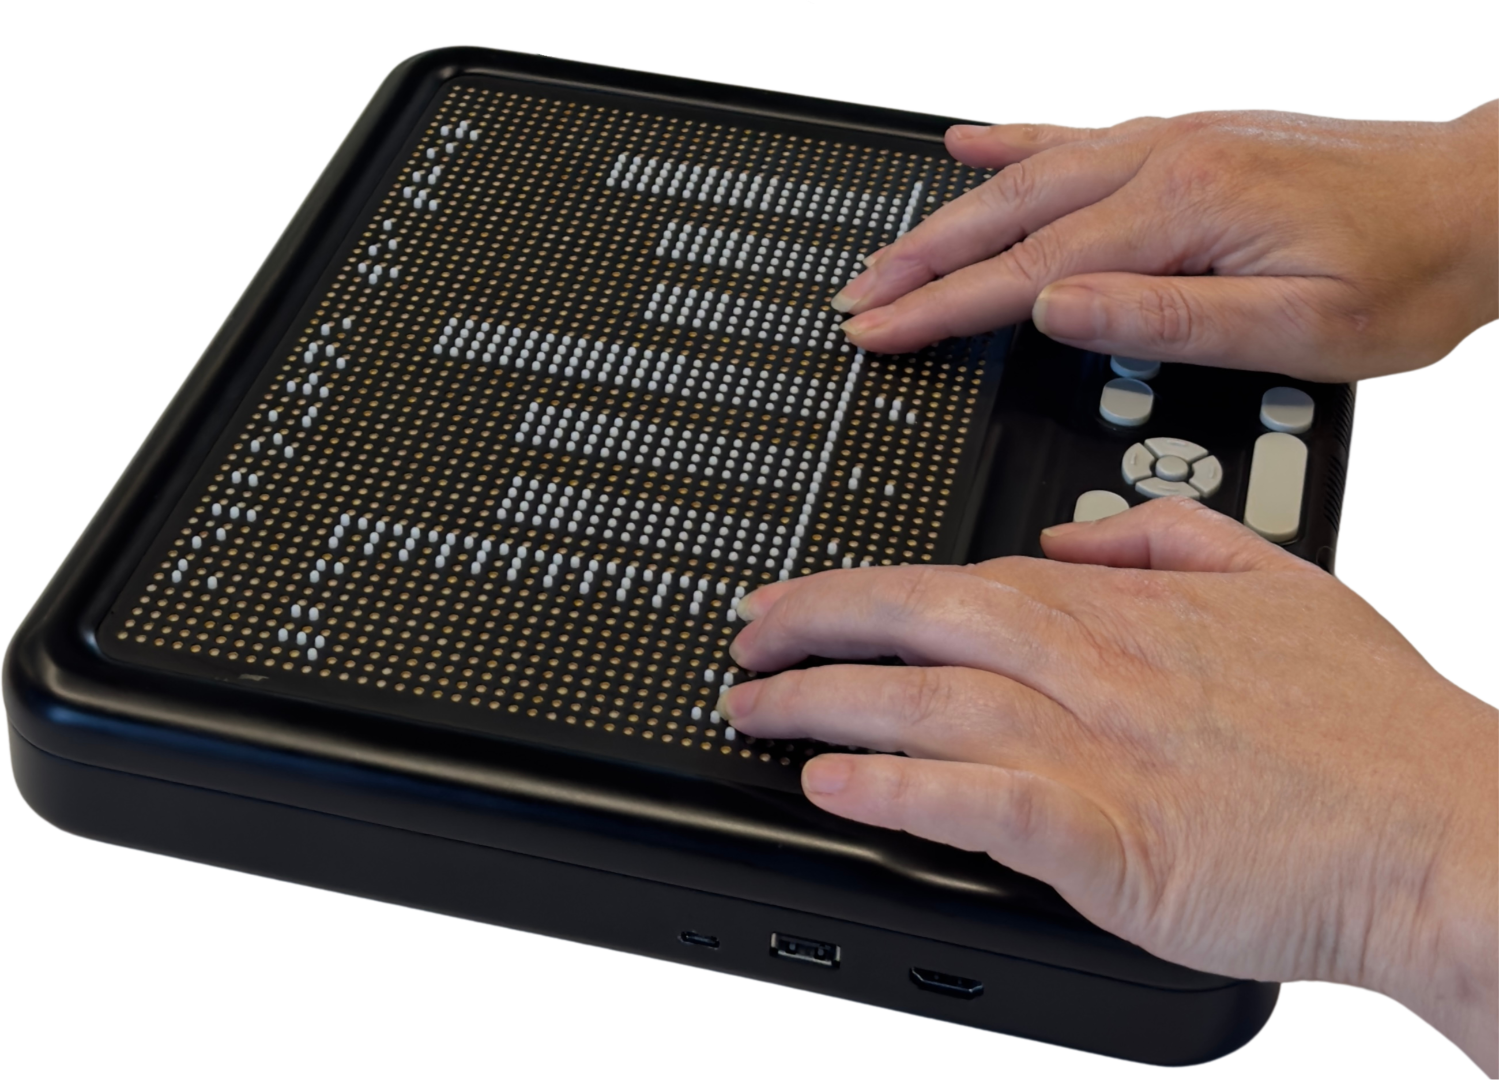
Despite the recent surge of research efforts to make data visualizations accessible to people who are blind or have low vision (BLV), how to support BLV people's data analysis remains an important and challenging question. As refreshable tactile displays (RTDs) become cheaper and conversational agents continue to improve, their combination provides a promising approach to support BLV people's interactive data exploration and analysis. To understand how BLV people would use and react to a system combining an RTD with a conversational agent, we conducted a Wizard-of-Oz study with 11 BLV participants, where they interacted with line charts, bar charts, and isarithmic maps. Our analysis of participants' interactions led to the identification of nine distinct patterns. We also learned that the choice of modalities depended on the type of task and prior experience with tactile graphics, and that participants strongly preferred the combination of RTD and speech to a single modality. In addition, participants with more tactile experience described how tactile images facilitated a deeper engagement with the data and supported independent interpretation. Our findings will inform the design of interfaces for such interactive mixed-modality systems.